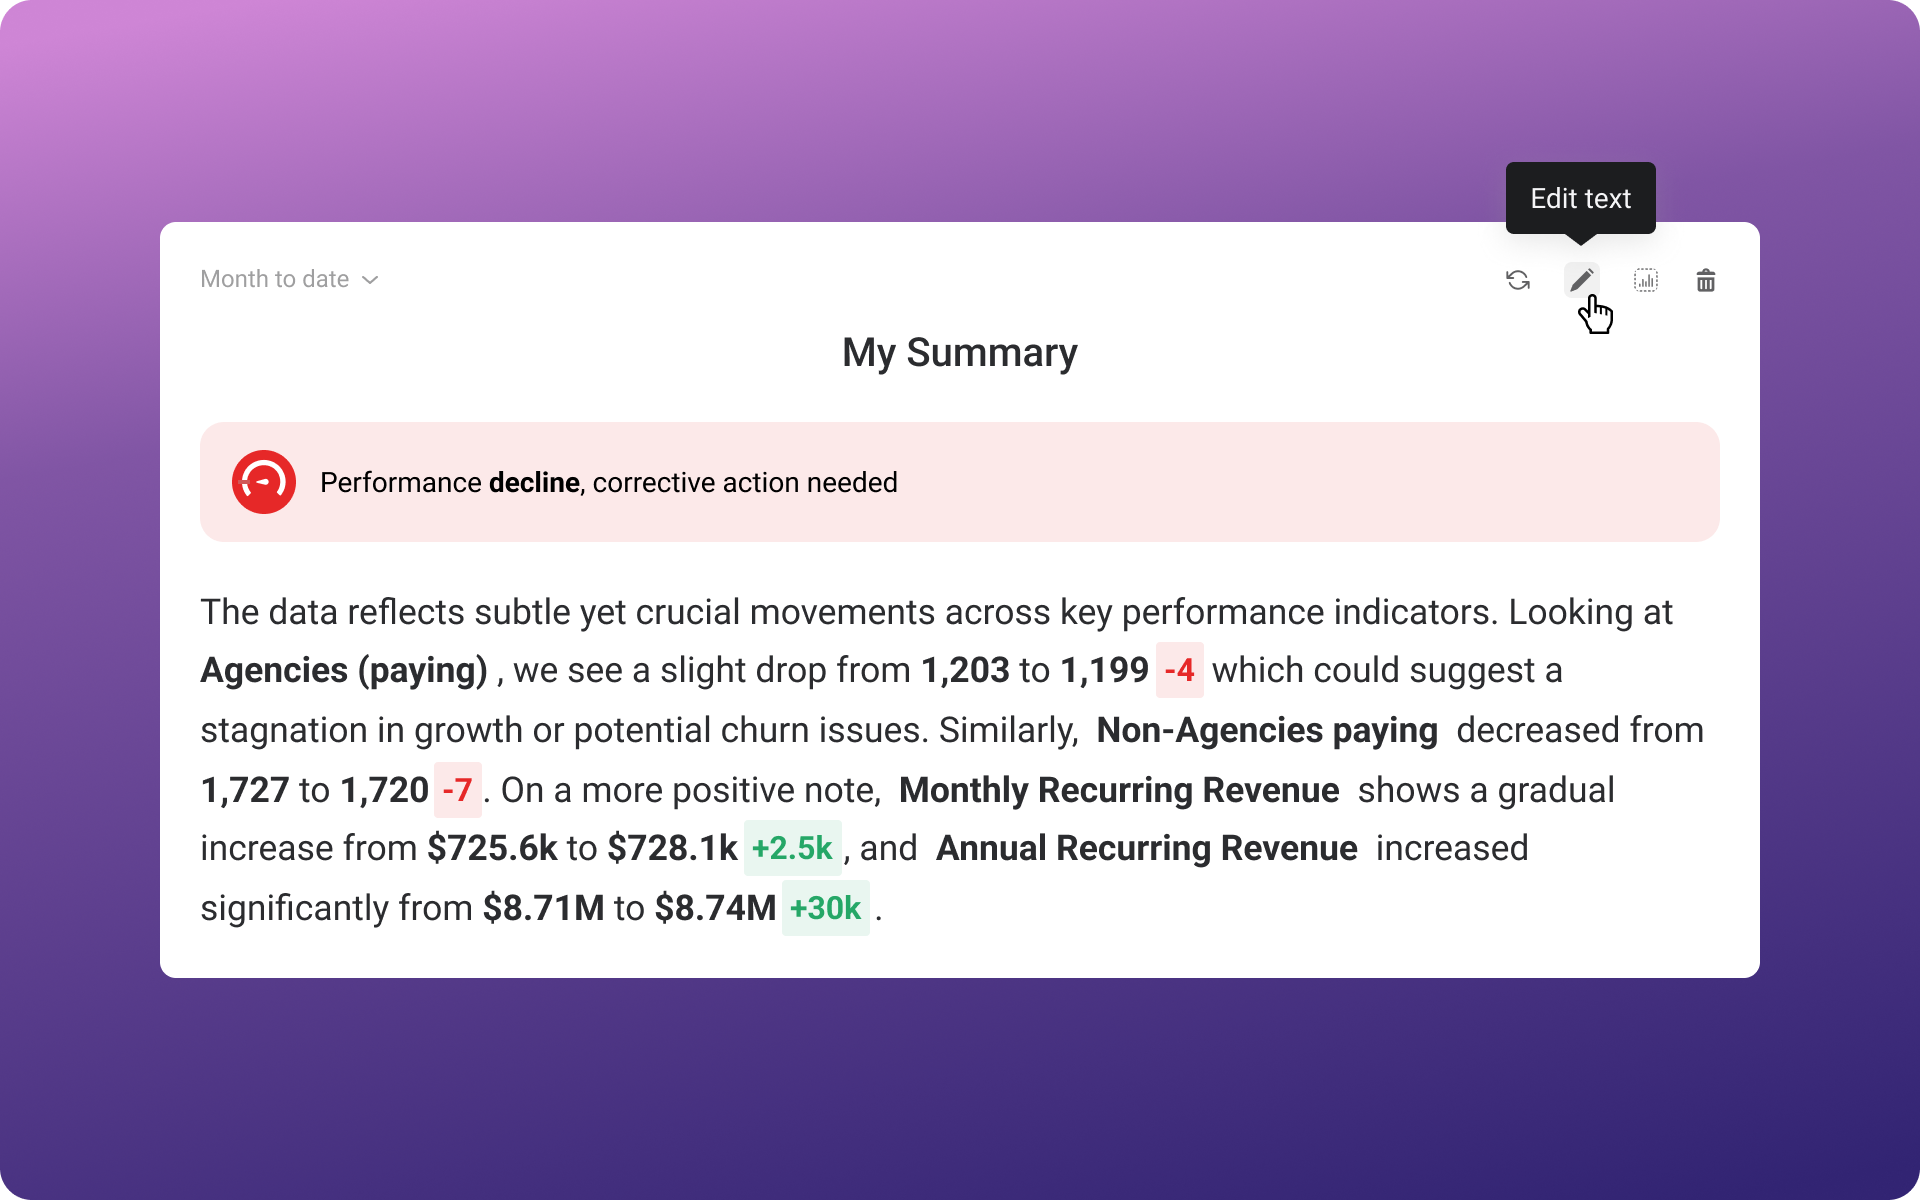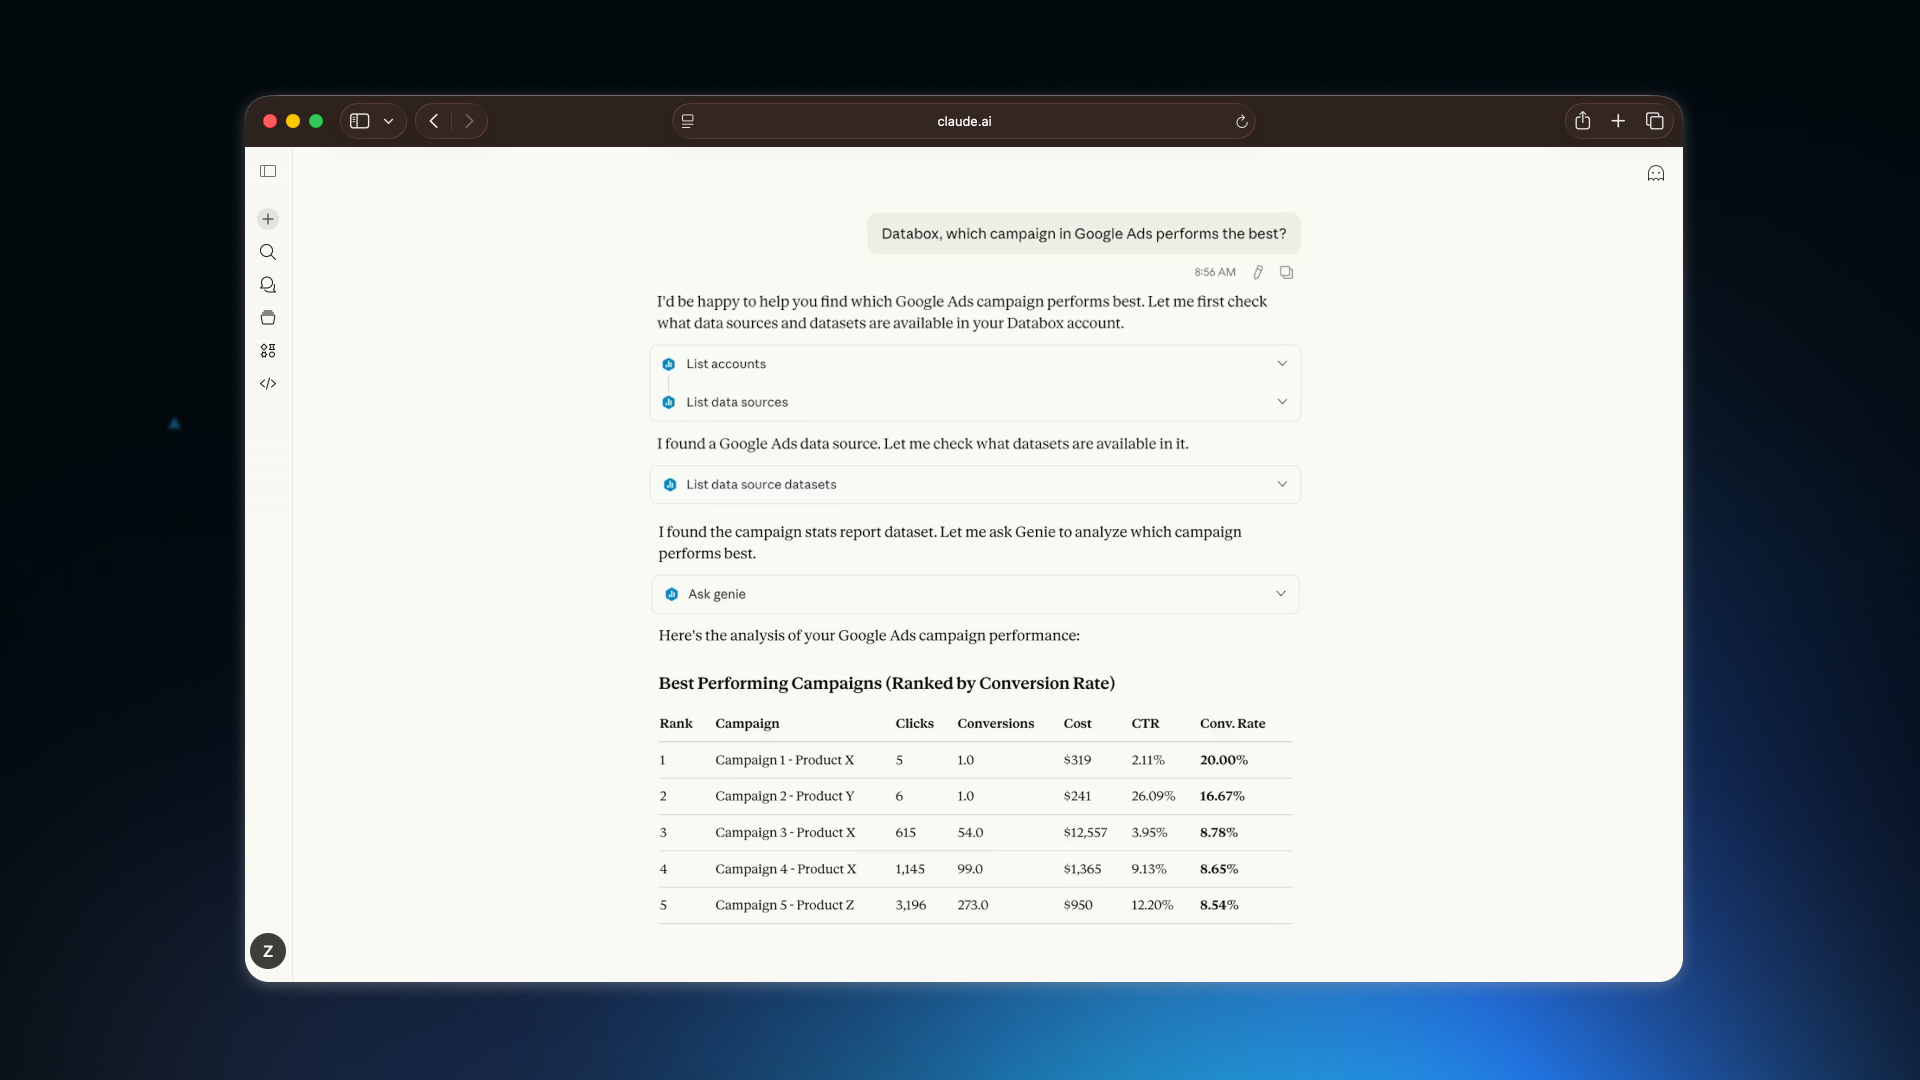
Connect Databox to tools like Claude, ChatGPT, n8n, and more, so you can answer questions faster, and act on them immediately.
- Ask questions and get reliable answers instantly, grounded in the metrics, definitions, and historical context your team already trusts
- Combine Databox data with information from other tools in the same conversation to understand what’s driving performance, without exporting or reworking data
- Move from insight to action faster by triggering workflows, alerts, and summaries automatically when performance changes
- Meet your team where they already work, so insights show up inside the AI tools and workflows they use every day